To start a program and measure the code coverage:


            - 
               Create a C/C++ QNX QConn (IP) launch configuration as you normally would, but don't click
                  OK yet. 


            - 
               On the launcher, click the Tools tab. 


            - 
               Click Add/Delete Tool. The Tools selection dialog appears. 


            - 
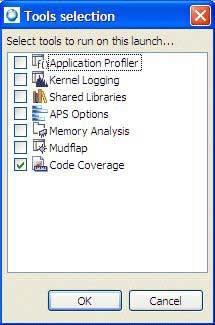
               Select the Code Coverage tool.


            - 
               Click OK. 


            - 
               Click the Code Coverage tab, and fill in these fields: 


                  - 
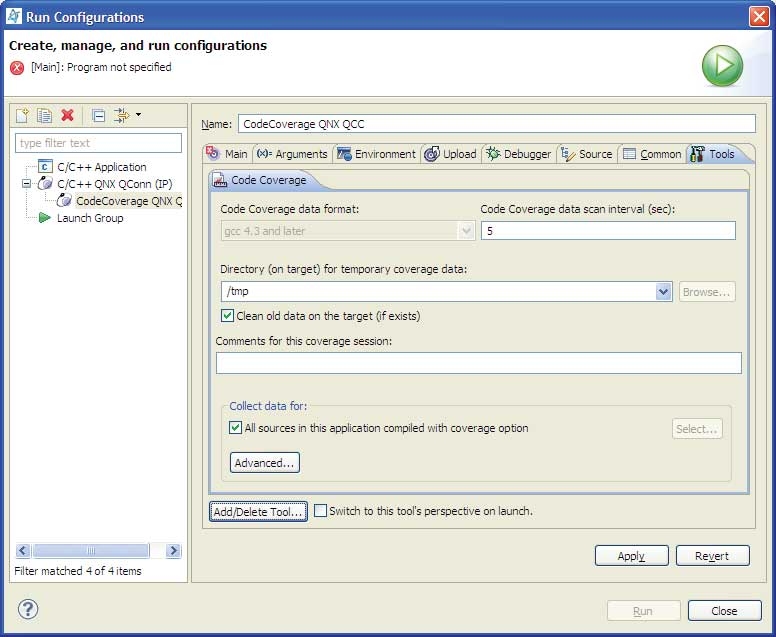
                     Code Coverage data format


                  - Select gcc 4.3 or later to enable code coverage metrics
                     collection if your application was compiled with gcc 4.3 or later.


                  - 
                     Comments for this Code Coverage session


                  - Your notes about the session, for your own personal use. The comments appear at the
                     top of the generated reports. 
                  
 
                  - 
                     Code Coverage data scan interval (sec)


                  - Sets how often the Code Coverage tool polls for data. A low setting can cause
                     continuous network traffic. The default setting of 5 seconds should be sufficient.


                  - 
                     Collect data for


                  - By default, all code coverage data built with code coverage in a project is included
                     in the current Code Coverage session. To include referenced projects or to only
                     collect data from certain sources, disable the option  All Sources in this
                        application compiled with code coverage, and then click
                     Select to select the projects or files that you want to
                     collect code coverage data for. 
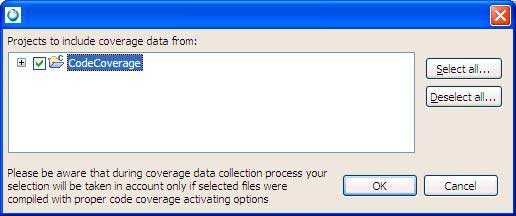
                  
 
                  - 
                     Select


                  - Opens the Projects to include Code Coverage data from dialog
                     so you can choose projects to include your coverage data (projects and files). Select
                     any project from this list that you wish to gather code coverage data for. Note that
                     projects must be built with code coverage enabled to capture data. 


            - 
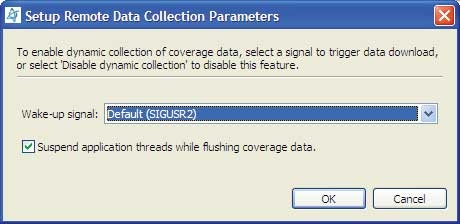
               Optional: Click Advanced to define a signal to enable the dynamic 
                  collection of code coverage data. The IDE will send a signal to suspend the application thread 
                  so that it can perform data collection. 


            - 
               Check Switch to this tool's perspective on launch if you want to
                  automatically go to the QNX Code Coverage perspective when you run or debug. 


            - 
               Click Apply. 


            - 
               Click Run or Debug.